
Medical Billing Dashboard Examples for Your Practice
A useful medical billing dashboard shows a handful of revenue cycle numbers, each with a target and a trend, so you can see in a minute whether cash is coming in on time. The best medical billing dashboard examples are small and specific: one view for leadership, one for denials, one for A/R aging, one for payers and one for the front end. Below are five dashboards, the KPIs on each, how to calculate them, and the mistakes that make dashboards useless.Dashboards are the visual layer on top of your reports; our guide to understanding medical billing reports covers the underlying data.
Revenue Cycle Dashboard Examples
1. Executive Summary Dashboard
This is the one-screen view for owners and managers. It shows net collections against target, days in A/R, denial rate and the share of A/R over 90 days, each with last month for comparison and a simple trend chart.
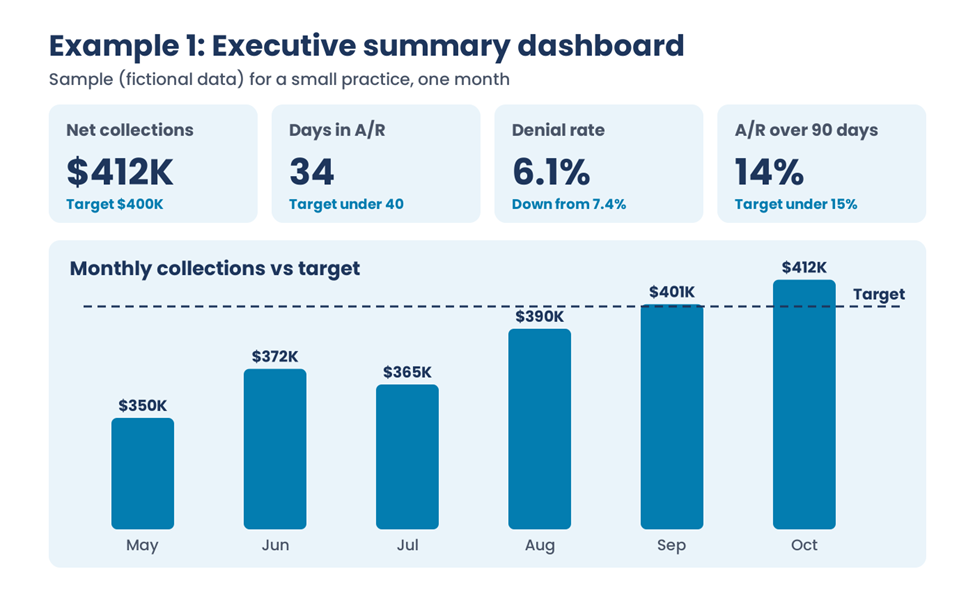
The sample above uses fictional numbers: four KPI tiles, each with a target or prior value, and six months of collections against a target line.
2. Denial Management Dashboard
This view ranks denials by reason code, payer and provider, and tracks the denial rate over time. It turns a pile of rejected claims into a short list of fixes. Pair it with the process in our denial management best practices.
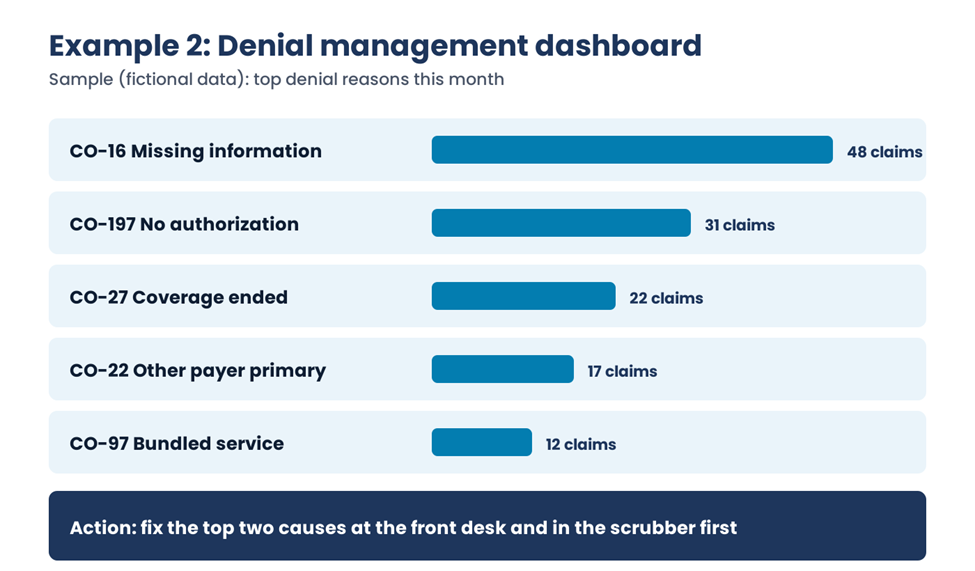
In this fictional sample, missing information and missing authorization account for most denials, so the front desk and the claim scrubber are where to start.
3. A/R Aging Dashboard
Show A/R in buckets of 0 to 30, 31 to 60, 61 to 90 and over 90 days, split by payer and by insurance versus patient balance. Watch the over-90 share most closely, because older claims are harder to collect and closer to filing limits. Our guide on reducing A/R days covers how to act on it.
4. Payer Performance Dashboard
Compare payers on days to payment, denial rate, underpayments against the contract and appeal success. This view supports contract talks and tells your team which payers need the closest follow-up.
5. Front-End and Charge Dashboard
Track the measures that prevent problems: eligibility checks completed before the visit, authorizations obtained, charge lag from date of service to charge entry, and the clean claim rate. Our article on clean claim rate explains how to improve that number.
KPI Formulas Behind the Dashboards
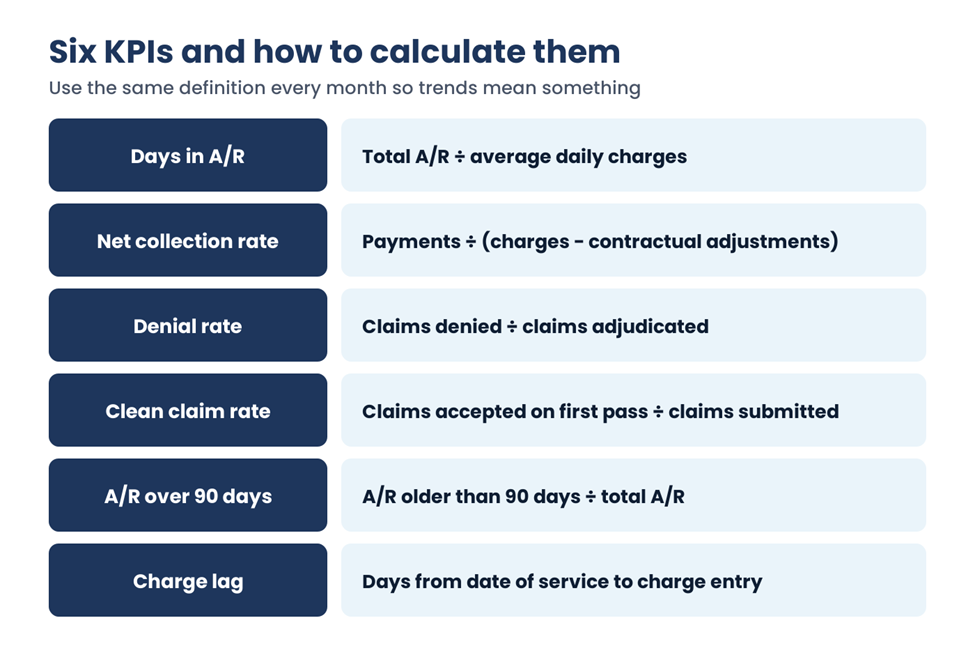
| KPI | Formula | What it tells you |
| Days in A/R | Total A/R ÷ average daily charges | How long it takes to get paid |
| Net collection rate | Payments ÷ (charges − contractual adjustments) | How much collectible money you actually collect |
| Denial rate | Claims denied ÷ claims adjudicated | How often payers reject the first time |
| Clean claim rate | Claims accepted on first pass ÷ claims submitted | How well the front end and scrubber work |
| A/R over 90 days | A/R older than 90 days ÷ total A/R | How much money is at risk of aging out |
| Charge lag | Days from date of service to charge entry | How fast claims get started |
Calculate average daily charges the same way every month, for example over the last three months. If you want standard definitions to compare against, the HFMA MAP Keys define common revenue cycle measures, including net days in A/R and denial rate. For more KPIs and their uses, see our list of medical billing KPIs every practice should track.
Setting Targets
Set targets from your own last 6 to 12 months first, then compare with published benchmarks for your specialty, such as those from MGMA or HFMA. A target based on your own history is one your team can reach, and the benchmark tells you how far you have to go.
Common Dashboard Mistakes
| Mistake | Better approach |
| Twenty metrics on one screen | Show four to six per dashboard, each with an owner. |
| Numbers without targets or trends | Add last month, the target and a six-month trend. |
| Formulas that change month to month | Write the definitions down and keep them fixed. |
| Data pulled by hand | Automate exports from the practice management system. |
| Nobody reviews it | Put it on a fixed weekly or monthly meeting agenda. |
Frequently Asked Questions
What should a medical billing dashboard include?
Start with net collections, days in A/R, denial rate, the share of A/R over 90 days and the clean claim rate, each shown with a target and a trend. Add separate views for denials, A/R aging and payers as the practice grows, rather than crowding everything onto one screen.
How do you calculate days in A/R?
Divide total accounts receivable by average daily charges. To get average daily charges, take total charges for a set period, such as the last three months, and divide by the number of days in that period. Use the same period every month so the trend is meaningful.
What is the difference between gross and net collection rate?
Gross collection rate compares payments with total charges, so it mostly reflects your fee schedule. Net collection rate compares payments with charges after contractual adjustments, showing how much of the money you’re actually owed you collect. Net collection rate is the more useful performance measure.
How often should dashboards be updated?
Operational views, such as denials and claim status, work best updated daily or weekly. Executive and payer views are usually reviewed monthly. What matters most is a regular review meeting where someone owns each number and decides what to do about it.
Building Medical Billing Dashboards That Get Used
The medical billing dashboard examples above work because each one answers a single question for a specific person. Start with the executive view, add the denial and A/R views, and keep the formulas fixed. EzMedPro can help set up reporting as part of our medical billing and RCM services.
Sources: HFMA MAP Keys. Dashboard examples use fictional sample data. This guide is general billing information, not financial advice.

